maotu
maotu引用echarts
其实和导入vue组件是一样的,本来不打算写了,但是有朋友问了,这里就做个简单的示例演示下。
只需要提前将图表封装好,并将需要动态改变的属性定义到props里即可,需要注意的是echarts改变宽高之后需要主动调用下resize方法
推荐使用vue-echarts这个库,然后给个autoresize属性就好了
安装vue-echarts
powershell
pnpm install echarts vue-echarts封装echarts组件
我这里命名为pie-charts
vue
<template>
  <v-chart class="chart" :option="option" autoresize />
</template>

<script lang="ts" setup>
import { use } from 'echarts/core';
import { SVGRenderer } from 'echarts/renderers';
import { PieChart } from 'echarts/charts';
import { TitleComponent, TooltipComponent, LegendComponent } from 'echarts/components';
import VChart, { THEME_KEY } from 'vue-echarts';
import { computed } from 'vue';
use([SVGRenderer, PieChart, TitleComponent, TooltipComponent, LegendComponent]);

const props = withDefaults(
  defineProps<{
    title: string;
    seriesName: string;
    seriesData: Array<{ name: string; value: number }>;
  }>(),
  {
    title: '标题',
    seriesName: '详情',
    seriesData: () => []
  }
);

const option = computed(() => {
  return {
    title: {
      text: props.title,
      left: 'center'
    },
    tooltip: {
      trigger: 'item',
      formatter: '{a} <br/>{b} : {c} ({d}%)'
    },
    legend: {
      orient: 'vertical',
      left: 'left'
    },
    series: [
      {
        name: props.seriesName,
        type: 'pie',
        radius: '55%',
        center: ['50%', '60%'],
        data: props.seriesData,
        emphasis: {
          itemStyle: {
            shadowBlur: 10,
            shadowOffsetX: 0,
            shadowColor: 'rgba(0, 0, 0, 0.5)'
          }
        }
      }
    ]
  };
});
</script>

<style scoped>
.chart {
  height: 100%;
  width: 100%;
}
</style>注册到maotu
js
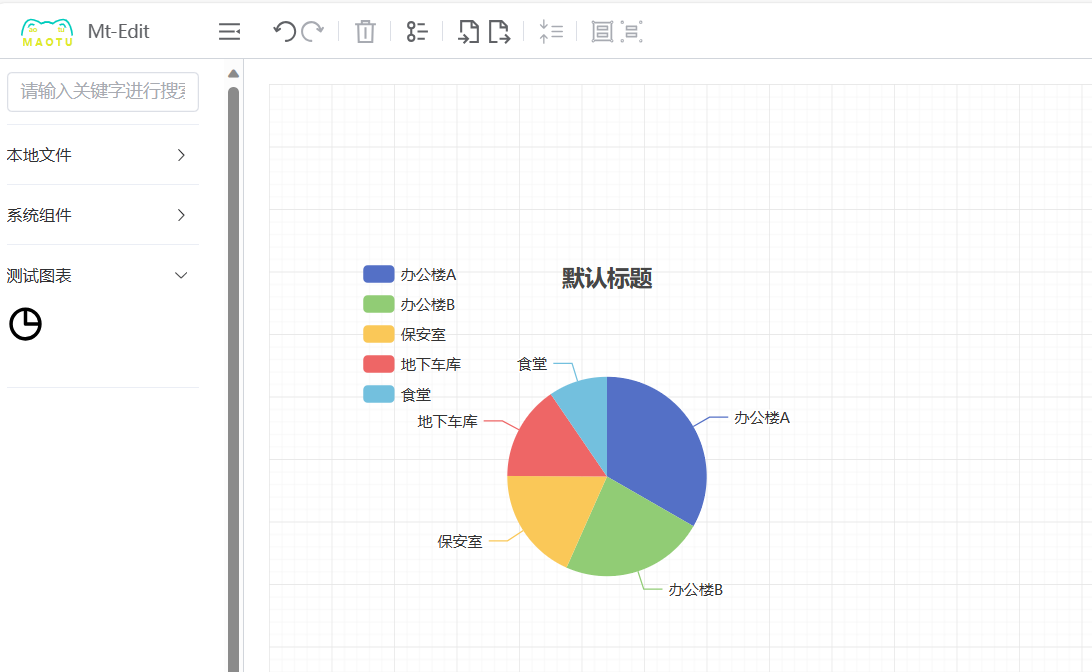
leftAsideStore.registerConfig('测试图表', [
  {
    id: 'pie-charts',
    title: 'echarts饼图',
    type: 'vue',
    thumbnail: '/svgs/pie-charts.svg',
    props: {
      title: {
        title: '标题',
        type: 'input',
        val: '默认标题'
      },
      seriesName: {
        title: '详情',
        type: 'input',
        val: '详情标题'
      },
      seriesData: {
        title: '数据',
        type: 'jsonEdit',
        val: [
          {
            value: 1048,
            name: '办公楼A'
          },
          {
            value: 735,
            name: '办公楼B'
          },
          {
            value: 580,
            name: '保安室'
          },
          {
            value: 484,
            name: '地下车库'
          },
          {
            value: 300,
            name: '食堂'
          }
        ]
      }
    }
  }
]);
此时一个图表的图形库便创建完毕了